How research can contribute to a more inclusive Rotterdam
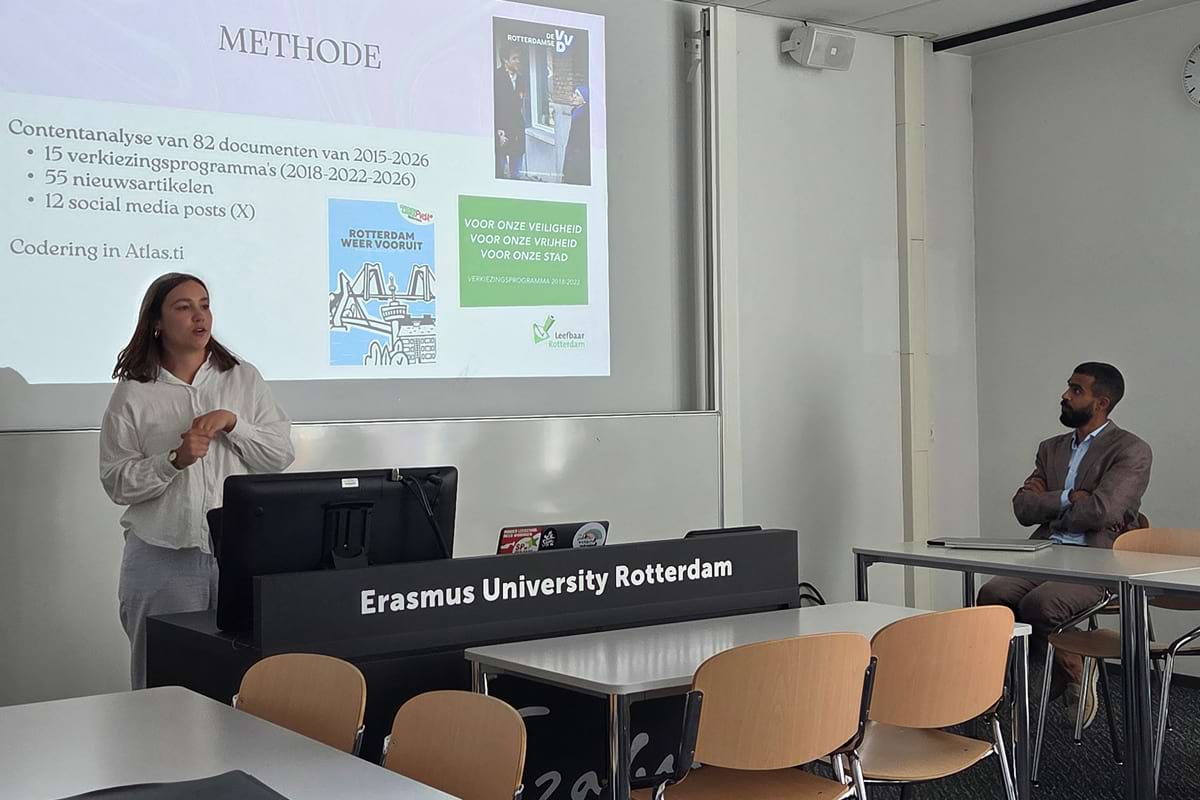
Thesis Hub Event brings research and practice together for a more inclusive Rotterdam
How can we bridge the gap between discrimination reports and discrimination experiences?
[ 1 ] How often do Rotterdammers experience discrimination?
Below you can see that Rotterdammers living in some neighbourhoods experience more discrimination than in others. The map shows how often residents of different neighbourhoods face discrimination. This map does not show where an incident happened but where the residents live. Discrimination often happens outside of the neighbourhood where someone lives.
0% – 7.4% HIGHLY UNPROBABLE
7.4% – 13.8% MIGHT BE PROBABLE
13.8% – 20.2% FAIRLY PROBABLE
20.2% – 26.6% HIGHLY PROBABLE
26.6% – 33% EXTREMELY PROBABLE
[ 2 ] In which neighbourhoods do residents face higher risks of discrimination?
See for yourself how present discrimination is in your neighbourhood compared to others. Play with the bars to order the neighbourhoods from highest to lowest on the score of predicted discrimination. The lower the score, the lower the prediction of people in the neighbourhood experiencing discrimination.
[ 3 ] Which factors influence discrimination?
Level of income and level of ethnic diversity are among a few factors that influence the chance of discrimination. The graph below shows the link between average income and the risk to experience discrimination across different neighbourhoods. Interested to see connections between other factors? Play with the data!